What is Deep Learning
Overview
Deep Learning
a type of machine learning based on artificial neural networks in which multiple layers of processing are used to extract progressively higher level features from data.
Machine Learning
development of computer systems that can learn to more accurately predict the outcomes without following explicit instructions, by using algorithms and statistical models to draw inferences from patterns in data.
Differences between Deep Learning and Machine Learning
Machine Learning
uses algorithms to parse data, learn from that data, and make informed decisions based on what it has learned.
needs a human to identify and hand-code the applied features based on the data type. | tries to learn features extraction and representation as well.
tend to parse data in parts, then combined those into a result (e.g. first number plate localization and then recognition).
requires relatively less data and training time
Deep learning
structures algorithms in layers to create an “artificial neural network” that can learn and make intelligent decisions on its own.
tries to learn features extraction and representation as well.
Deep learning systems look at an entire problem and generate the final result in one go (e.g. outputs the coordinates and the class of object together).
requires a lot more data and training time
Applications Of Machine Learning/Deep Learning
Email spam detection
Fingerprint / face detection & matching (e.g., phones)
Web search (e.g., DuckDuckGo, Bing, Google)
Sports predictions
ATMs (e.g., reading checks)
Credit card fraud
Stock predictions
Perceptron
Definition
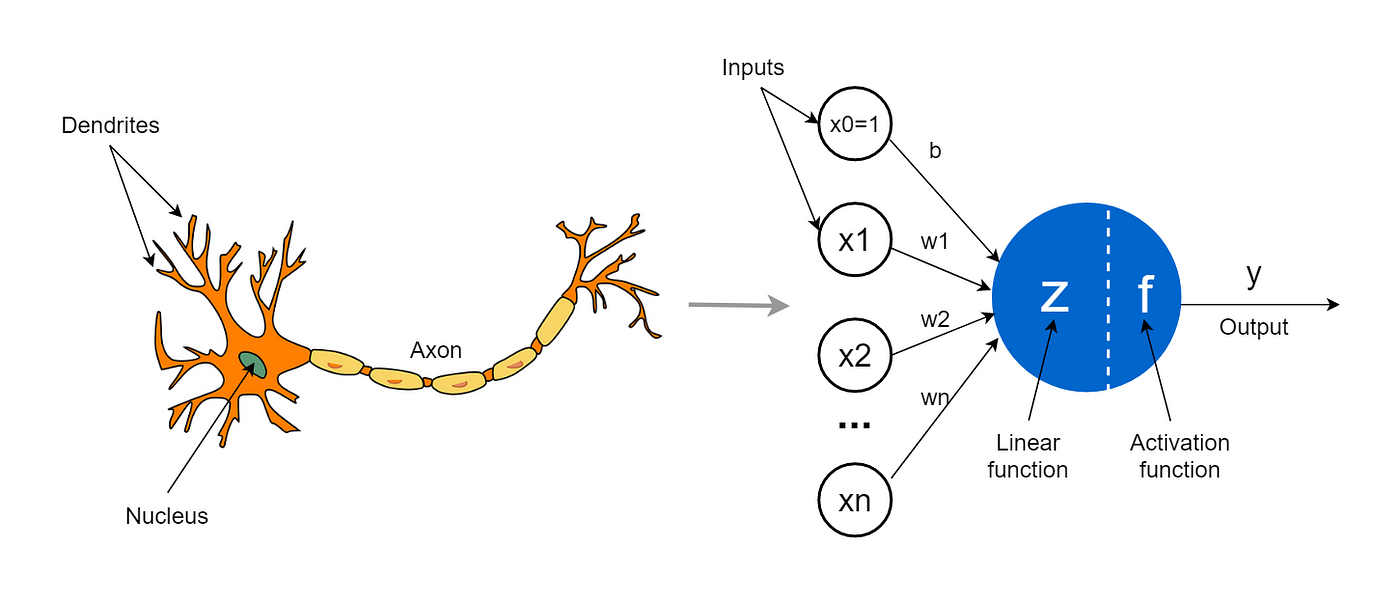
Simplest artificial neuron that takes binary inputs and based on their weighted sum reaching a threshold, generates a binary output.
Artificial neurons
Takes in multiple inputs and learns what should be the appropriate output
Essentially a mathematical function where the weights multiplied with the inputs are learnable
Acts like a logic gate but the operation performed adjusts according to the data
History of the Perceptron
Invented in 1957 by Frank Rosenblatt to binary classify an input data.
An attempt to replicate the process and ability of human nervous system.
Terminology
Net input \(=\) weighted inputs, \(z\)
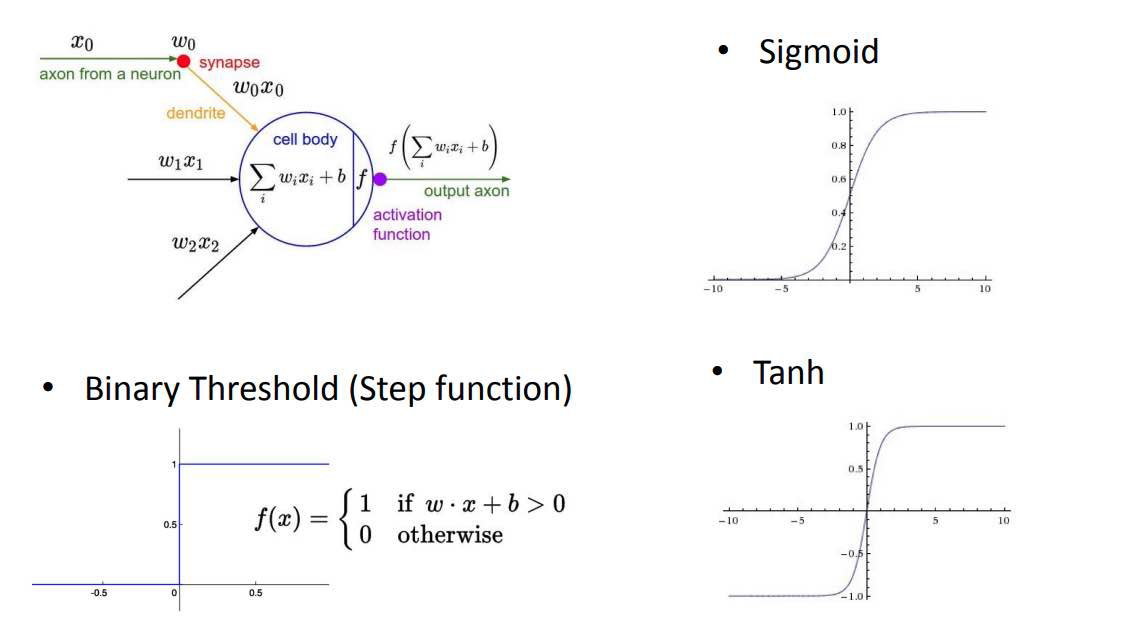
Activations = activation function(net input); \(a=\sigma(z)\)
Label output \(=\) threshold(activations of last layer); \(\hat{y}=f(a)\)
Special cases:
In perceptron: activation function = threshold function
In linear regression: activation \(=\) net input \(=\) output
Often more convenient notation: define bias unit as \(w_0\) and prepend a 1 to each input vector as an additional feature value
Perceptron Learning
Sure! Let’s delve into the Perceptron Learning Rule and the Delta Rule, explore their differences with detailed explanations and examples, and then implement both using PyTorch for a binary classification task.
Both the Perceptron Learning Rule and the Delta Rule are fundamental algorithms used in training single-layer neural networks for binary classification tasks. They adjust the weights of the network based on the input data and the error in the output.
Perceptron Learning Rule: Specifically designed for classification tasks using a step (Heaviside) activation function.
Delta Rule: Designed to minimize the mean squared error using a differentiable activation function, often used with gradient descent.
Perceptron Learning Rule
The Perceptron Learning Rule is an algorithm for supervised learning of binary classifiers. It adjusts the weights of the input features based on misclassifications.
How It Works
Initialization: Initialize the weights (including bias) to small random values or zeros.
Activation Function: Use a step function to determine the output:
\[\begin{split} y = \begin{cases} 1 & \text{if } \mathbf{w} \cdot \mathbf{x} + b > 0 \\ 0 & \text{otherwise} \end{cases} \end{split}\]Weight Update Rule:
\[ \mathbf{w} \leftarrow \mathbf{w} + \Delta \mathbf{w} \]\[ \Delta \mathbf{w} = \eta (d - y) \mathbf{x} \]\[ \Delta b = \eta (d - y) \]Where:
\( \eta \) is the learning rate.
\( d \) is the desired output.
\( y \) is the actual output.
Iteration: Repeat the process for all training samples until convergence (no misclassifications) or a maximum number of epochs is reached.
Mathematical Example
The Perceptron is a linear classifier that updates its weights based on the Perceptron Learning Rule. Let’s start with a toy example.
Suppose we have the following 2D data points:
Data Point (x1, x2) |
Label |
|---|---|
(2, 3) |
+1 |
(4, 1) |
+1 |
(1, 1) |
-1 |
(2, 0) |
-1 |
Class 1 (Label +1): \( (2, 3) \) and \( (4, 1) \)
Class 2 (Label -1): \( (1, 1) \) and \( (2, 0) \)
We initialize the weight vector \( \mathbf{w} = [w_1, w_2]^T \) and the bias \( b \) to zero.
The Perceptron Learning Rule updates the weights and bias using the following formula:
Update rule: \( \mathbf{w} \leftarrow \mathbf{w} + \eta \cdot y_i \cdot \mathbf{x}_i \)
Bias update: \( b \leftarrow b + \eta \cdot y_i \)
where:
\( \eta \) is the learning rate (let’s assume \( \eta = 1 \)),
\( y_i \) is the label of the \( i \)-th data point (\(+1\) or \(-1\)),
\( \mathbf{x}_i \) is the input vector for the \( i \)-th data point.
Steps:
Iteration 1:
Data Point: \( (2, 3) \) with \( y_1 = +1 \)
Prediction: \( \text{sign}(\mathbf{w} \cdot \mathbf{x}_1 + b) = \text{sign}(0) = 0 \) (incorrect)
Update:
\( \mathbf{w} \leftarrow \mathbf{w} + 1 \cdot (+1) \cdot [2, 3]^T = [2, 3]^T \)
\( b \leftarrow b + 1 \cdot (+1) = 1 \)
Iteration 2:
Data Point: \( (4, 1) \) with \( y_2 = +1 \)
Prediction: \( \text{sign}([2, 3] \cdot [4, 1]^T + 1) = \text{sign}(8 + 3 + 1) = \text{sign}(12) = +1 \) (correct)
No update since the prediction is correct.
Iteration 3:
Data Point: \( (1, 1) \) with \( y_3 = -1 \)
Prediction: \( \text{sign}([2, 3] \cdot [1, 1]^T + 1) = \text{sign}(2 + 3 + 1) = \text{sign}(6) = +1 \) (incorrect)
Update:
\( \mathbf{w} \leftarrow [2, 3]^T + 1 \cdot (-1) \cdot [1, 1]^T = [1, 2]^T \)
\( b \leftarrow 1 + (-1) = 0 \)
Iteration 4:
Data Point: \( (2, 0) \) with \( y_4 = -1 \)
Prediction: \( \text{sign}([1, 2] \cdot [2, 0]^T + 0) = \text{sign}(2) = +1 \) (incorrect)
Update:
\( \mathbf{w} \leftarrow [1, 2]^T + 1 \cdot (-1) \cdot [2, 0]^T = [-1, 2]^T \)
\( b \leftarrow 0 + (-1) = -1 \)
Final weight vector: \( \mathbf{w} = [-1, 2]^T \) Final bias: \( b = -1 \)
Now, let’s implement this in PyTorch and visualize the decision boundary.
The
torch.signfunction is used to get the prediction from the model.We update the weights and bias whenever the prediction is incorrect.
The decision boundary is plotted as a line where \( x_2 = \frac{-w_1 \cdot x_1 - b}{w_2} \).
This code will produce a plot showing the decision boundary learned by the Perceptron, separating the two classes.
import torch
import matplotlib.pyplot as plt
import numpy as np
from matplotlib.animation import FuncAnimation
from IPython.display import HTML

# Enable interactive mode
%matplotlib notebook

# Data points (x1, x2) and their labels
data = torch.tensor([[2, 3], [4, 1], [1, 1], [2, 0]], dtype=torch.float32)
labels = torch.tensor([1, 1, -1, -1], dtype=torch.float32)

# Initialize weights and bias
weights = torch.zeros(2, requires_grad=False)
bias = torch.zeros(1, requires_grad=False)
learning_rate = 1.0

# Store the history of weights and bias
history = []

# Perceptron Learning Rule
for epoch in range(10):  # Run for 10 epochs or until convergence
    for i, point in enumerate(data):
        # Calculate the prediction
        prediction = torch.sign(torch.dot(weights, point) + bias)
        if prediction != labels[i]:  # Misclassified point
            # Update weights and bias
            weights += learning_rate * labels[i] * point
            bias += learning_rate * labels[i]
        # Store the current state of weights and bias
        history.append((weights.clone(), bias.clone()))

# Visualization of the decision boundary
fig, ax = plt.subplots()

def plot_decision_boundary(weights, bias):
    x1 = np.linspace(0, 5, 100)
    x2 = (-weights[0].item() * x1 - bias.item()) / weights[1].item()

    ax.clear()
    ax.plot(x1, x2, label="Decision Boundary")
    ax.scatter(data[:, 0], data[:, 1], c=labels, cmap='bwr')
    ax.set_xlim(0, 5)
    ax.set_ylim(0, 4)
    ax.set_xlabel('x1')
    ax.set_ylabel('x2')
    ax.set_title('Perceptron Decision Boundary')
    ax.legend()
    ax.grid(True)

    # Add text annotations for weights and bias
    weight_text = f"Weights: w1={weights[0].item():.2f}, w2={weights[1].item():.2f}"
    bias_text = f"Bias: b={bias.item():.2f}"
    ax.text(0.05, 0.95, weight_text, transform=ax.transAxes, fontsize=12, verticalalignment='top')
    ax.text(0.05, 0.90, bias_text, transform=ax.transAxes, fontsize=12, verticalalignment='top')

def animate(i):
    weights, bias = history[i]
    plot_decision_boundary(weights, bias)

# Create animation
ani = FuncAnimation(fig, animate, frames=len(history), interval=500)

# Display animation in the notebook
HTML(ani.to_jshtml())
Delta Rule (Gradient Descent)
The Delta Rule (also known as the Widrow-Hoff learning rule) is a fundamental algorithm in machine learning that uses gradient descent to minimize the error between predicted and true labels in a perceptron. It’s a linear classifier that makes updates to the weights and bias based on the prediction error. The key distinction from the Perceptron Learning Rule is that it applies continuous updates rather than binary (discrete) updates.
Let’s walk through the Delta Rule with a toy example both mathematically and programmatically in PyTorch, including visualization of the decision boundary evolution.
Mathematical Explanation of the Delta Rule
Let’s say we have a dataset of 2D points:
\( \mathbf{x_1} = [2, 3], y_1 = +1 \)
\( \mathbf{x_2} = [4, 1], y_2 = +1 \)
\( \mathbf{x_3} = [1, 1], y_3 = -1 \)
\( \mathbf{x_4} = [2, 0], y_4 = -1 \)
These points are labeled as either \( +1 \) or \( -1 \), and we aim to find a decision boundary that separates these points.
Steps of Delta Rule:
Initialize weights \( \mathbf{w} = [w_1, w_2] \) and bias \( b \) to zeros or small random values.
\[ \mathbf{w} = [0, 0], \quad b = 0 \]Prediction for any point \( \mathbf{x} = (x_1, x_2) \) :
\[ y_{\text{pred}} = \mathbf{w} \cdot \mathbf{x} + b = w_1 x_1 + w_2 x_2 + b \]Here, we don’t use the step function like in the Perceptron Learning Rule. Instead, we compute the raw value and use it directly for updates.
Error Calculation:
\[ \text{error} = y_{\text{true}} - y_{\text{pred}} \]Gradient Descent Weight Update (Delta Rule):\
\[ \mathbf{w} = \mathbf{w} + \eta \cdot \text{error} \cdot \mathbf{x} \]\[ b = b + \eta \cdot \text{error} \]Where \( \eta \) is the learning rate.
Repeat this process for a fixed number of epochs or until the error converges (becomes very small).
Example of One Update:
Let’s say we start with \( \mathbf{w} = [0, 0] \), \( b = 0 \), and take the first point \( \mathbf{x_1} = [2, 3] \), \( y_1 = 1 \).
Prediction: \( y_{\text{pred}} = 0 \cdot 2 + 0 \cdot 3 + 0 = 0 \)
Error: \( \text{error} = 1 - 0 = 1 \)
Weight Update: \( w_1 = 0 + 0.1 \cdot 1 \cdot 2 = 0.2 \), \( w_2 = 0 + 0.1 \cdot 1 \cdot 3 = 0.3 \)
Bias Update: \( b = 0 + 0.1 \cdot 1 = 0.1 \)
Thus, after the first update, the weights and bias become:
Initialization:
We initialize the weights and bias as zero tensors.
The learning rate is set to \( 0.1 \). Prediction:
For each point in the dataset, we compute the predicted output using the linear equation \( y_{\text{pred}} = \mathbf{w} \cdot \mathbf{x} + b \).
Error Calculation:
The error is calculated as \( \text{error} = y_{\text{true}} - y_{\text{pred}} \).
Weight and Bias Updates:
We update the weights and bias using the gradient descent rule:
The weights and bias are updated after each point is processed.
Visualization:
We use Matplotlib’s
FuncAnimationto visualize the decision boundary as it evolves with each update.The decision boundary is calculated as the line where the equation \( w_1 x_1 + w_2 x_2 + b = 0 \) holds. Rearranging for \( x_2 \):
The weights and bias are displayed on the plot as text annotations during each iteration.
import torch
import matplotlib.pyplot as plt
import numpy as np
from matplotlib.animation import FuncAnimation
from IPython.display import HTML

# Enable interactive mode
%matplotlib notebook

# Data points (x1, x2) and their labels
data = torch.tensor([[2, 3], [4, 1], [1, 1], [2, 0]], dtype=torch.float32)
labels = torch.tensor([1, 1, -1, -1], dtype=torch.float32)

# Initialize weights and bias
weights = torch.zeros(2, requires_grad=False)
bias = torch.zeros(1, requires_grad=False)
learning_rate = 0.1  # Learning rate

# Store the history of weights and bias
history = []

# Delta Rule (Gradient Descent)
for epoch in range(10):  # Run for 10 epochs
    for i, point in enumerate(data):
        # Calculate the prediction (linear output, not step function)
        y_pred = torch.dot(weights, point) + bias

        # Calculate the error (difference between true label and prediction)
        error = labels[i] - y_pred

        # Update weights and bias using the Delta Rule
        weights += learning_rate * error * point
        bias += learning_rate * error

        # Store the current state of weights and bias
        history.append((weights.clone(), bias.clone()))

# Visualization of the decision boundary
fig, ax = plt.subplots()

def plot_decision_boundary(weights, bias):
    x1 = np.linspace(0, 5, 100)
    x2 = (-weights[0].item() * x1 - bias.item()) / weights[1].item()

    ax.clear()
    ax.plot(x1, x2, label="Decision Boundary")
    ax.scatter(data[:, 0], data[:, 1], c=labels, cmap='bwr')
    ax.set_xlim(0, 5)
    ax.set_ylim(0, 4)
    ax.set_xlabel('x1')
    ax.set_ylabel('x2')
    ax.set_title('Delta Rule Decision Boundary')
    ax.legend()
    ax.grid(True)

    # Add text annotations for weights and bias
    weight_text = f"Weights: w1={weights[0].item():.2f}, w2={weights[1].item():.2f}"
    bias_text = f"Bias: b={bias.item():.2f}"
    ax.text(0.05, 0.95, weight_text, transform=ax.transAxes, fontsize=12, verticalalignment='top')
    ax.text(0.05, 0.90, bias_text, transform=ax.transAxes, fontsize=12, verticalalignment='top')

def animate(i):
    weights, bias = history[i]
    plot_decision_boundary(weights, bias)

# Create animation
ani = FuncAnimation(fig, animate, frames=len(history), interval=500)

# Display animation in the notebook
HTML(ani.to_jshtml())
How It Works
Initialization: Initialize the weights (including bias) to small random values or zeros.
Activation Function: Use a differentiable activation function, typically linear or sigmoid.
\[ y = \sigma(\mathbf{w} \cdot \mathbf{x} + b) \]Where \( \sigma \) is the activation function.
Error Calculation:
\[ E = \frac{1}{2} (d - y)^2 \]Weight Update Rule:
\[ \Delta \mathbf{w} = \eta (d - y) \mathbf{x} \]\[ \Delta b = \eta (d - y) \]This is derived from gradient descent, aiming to minimize the error \( E \).
Iteration: Repeat the process for all training samples until the error converges or a maximum number of epochs is reached.
Example
Using the same dataset as above but with a linear activation function, the Delta Rule adjusts the weights to minimize the squared difference between the predicted and actual labels.
4. Key Differences Between Perceptron and Delta Rules
Aspect |
Perceptron Learning Rule |
Delta Rule |
|---|---|---|
Purpose |
Binary classification |
Minimizing mean squared error |
Activation Function |
Step function (non-differentiable) |
Differentiable (e.g., linear, sigmoid) |
Weight Update |
Only when misclassification occurs |
Always updates based on the error |
Convergence Guarantee |
Converges if data is linearly separable |
Minimizes error, can converge even if not separable |
Use Case |
Perceptron models |
Linear regression, neural networks |
Error Signal |
Binary (only misclassified points) |
Continuous (based on the magnitude of error) |
Summary
Perceptron Learning Rule is suitable for scenarios where the data is linearly separable and requires a strict classification boundary.
Delta Rule provides a smoother learning process by considering the magnitude of errors, making it suitable for regression tasks and more nuanced classification.
Practical Implementation with PyTorch
We’ll implement both the Perceptron Learning Rule and the Delta Rule using PyTorch on a synthetic binary classification dataset. We’ll visualize the learning process using Matplotlib.
We’ll create a simple, linearly separable dataset for demonstration purposes.
import torch
import matplotlib.pyplot as plt
import numpy as np

# Set random seed for reproducibility
torch.manual_seed(0)

# Generate synthetic data
def generate_data(n_samples=100):
    # Class 0: centered at (2, 2)
    class0 = torch.randn(n_samples, 2) + torch.tensor([2, 2])
    # Class 1: centered at (4, 4)
    class1 = torch.randn(n_samples, 2) + torch.tensor([4, 4])
    X = torch.cat((class0, class1), dim=0)
    y = torch.cat((torch.zeros(n_samples), torch.ones(n_samples)), dim=0)
    return X, y

X, y = generate_data(100)

# Plot the data
plt.figure(figsize=(8,6))
plt.scatter(X[y==0, 0], X[y==0, 1], color='red', label='Class 0')
plt.scatter(X[y==1, 0], X[y==1, 1], color='blue', label='Class 1')
plt.xlabel('Feature 1')
plt.ylabel('Feature 2')
plt.legend()
plt.title('Synthetic Binary Classification Data')
plt.show()
## Perceptron Implementation

## We'll implement the Perceptron using the Perceptron Learning Rule.

class Perceptron:
    def __init__(self, input_dim, lr=0.1):
        # Initialize weights and bias
        self.weights = torch.zeros(input_dim)
        self.bias = 0.0
        self.lr = lr
        self.history = []

    def activation(self, x):
        return torch.where(x >= 0, 1.0, 0.0)

    def predict(self, x):
        linear_output = torch.dot(self.weights, x) + self.bias
        return self.activation(linear_output)

    def fit(self, X, y, epochs=10):
        for epoch in range(epochs):
            errors = 0
            for xi, target in zip(X, y):
                output = self.predict(xi)
                error = target - output
                if error != 0:
                    self.weights += self.lr * error * xi
                    self.bias += self.lr * error
                    errors += 1
            self.history.append(errors)
            print(f'Epoch {epoch+1}/{epochs}, Misclassifications: {errors}')
            if errors == 0:
                break
# Delta Rule Implementation

# We'll implement the Delta Rule using gradient descent to minimize the mean squared error.
class DeltaRule:
    def __init__(self, input_dim, lr=0.1):
        # Initialize weights and bias
        self.weights = torch.zeros(input_dim, requires_grad=True)
        self.bias = torch.tensor(0.0, requires_grad=True)
        self.lr = lr
        self.history = []

    def activation(self, x):
        # Linear activation
        return x

    def predict(self, x):
        linear_output = torch.dot(self.weights, x) + self.bias
        return self.activation(linear_output)

    def fit(self, X, y, epochs=10):
        for epoch in range(epochs):
            total_error = 0.0
            for xi, target in zip(X, y):
                output = self.predict(xi)
                error = target - output
                total_error += error.item() ** 2
                # Compute gradients
                error.backward()
                # Update weights and bias
                with torch.no_grad():
                    self.weights += self.lr * error * xi
                    self.bias += self.lr * error
                # Zero gradients
                self.weights.grad = None
                self.bias.grad = None
            self.history.append(total_error)
            print(f'Epoch {epoch+1}/{epochs}, Total MSE: {total_error:.4f}')
Training and Visualization
We’ll train both models and visualize their learning progress and decision boundaries.
# Instantiate models
perceptron = Perceptron(input_dim=2, lr=0.1)
delta_rule = DeltaRule(input_dim=2, lr=0.01)

# Train Perceptron
print("Training Perceptron:")
perceptron.fit(X, y, epochs=20)

# Train Delta Rule
print("\nTraining Delta Rule:")
delta_rule.fit(X, y, epochs=20)

# Plot Misclassifications for Perceptron
plt.figure(figsize=(8,6))
plt.plot(range(1, len(perceptron.history)+1), perceptron.history, marker='o')
plt.xlabel('Epoch')
plt.ylabel('Number of Misclassifications')
plt.title('Perceptron Learning Progress')
plt.show()

# Plot MSE for Delta Rule
plt.figure(figsize=(8,6))
plt.plot(range(1, len(delta_rule.history)+1), delta_rule.history, marker='o', color='green')
plt.xlabel('Epoch')
plt.ylabel('Total Mean Squared Error')
plt.title('Delta Rule Learning Progress')
plt.show()

# Function to plot decision boundary
def plot_decision_boundary(model, X, y, title):
    x_min, x_max = X[:,0].min()-1, X[:,0].max()+1
    y_min, y_max = X[:,1].min()-1, X[:,1].max()+1
    xx, yy = np.meshgrid(np.linspace(x_min, x_max, 100),
                         np.linspace(y_min, y_max, 100))
    grid = torch.tensor(np.c_[xx.ravel(), yy.ravel()], dtype=torch.float)
    with torch.no_grad():
        if isinstance(model, Perceptron):
            Z = model.predict(grid).reshape(xx.shape)
        else:
            Z = model.predict(grid).reshape(xx.shape)
            Z = torch.sigmoid(Z) > 0.5
    Z = Z.numpy()
    plt.contourf(xx, yy, Z, alpha=0.2, levels=[-1,0,1], colors=['red','blue'])
    plt.scatter(X[y==0, 0], X[y==0, 1], color='red', label='Class 0')
    plt.scatter(X[y==1, 0], X[y==1, 1], color='blue', label='Class 1')
    plt.xlabel('Feature 1')
    plt.ylabel('Feature 2')
    plt.title(title)
    plt.legend()
    plt.show()

# Plot Decision Boundary for Perceptron
# plot_decision_boundary(perceptron, X, y, 'Perceptron Decision Boundary')

# # Plot Decision Boundary for Delta Rule
# # For Delta Rule, apply sigmoid for binary classification
# class DeltaRuleSigmoid(DeltaRule):
#     def activation(self, x):
#         return torch.sigmoid(x)

# delta_rule_sigmoid = DeltaRuleSigmoid(input_dim=2, lr=0.1)
# print("\nTraining Delta Rule with Sigmoid Activation:")
# delta_rule_sigmoid.fit(X, y, epochs=100)
# plot_decision_boundary(delta_rule_sigmoid, X, y, 'Delta Rule (Sigmoid) Decision Boundary')
Training Perceptron:
Epoch 1/20, Misclassifications: 2
Epoch 2/20, Misclassifications: 4
Epoch 3/20, Misclassifications: 3
Epoch 4/20, Misclassifications: 4
Epoch 5/20, Misclassifications: 3
Epoch 6/20, Misclassifications: 4
Epoch 7/20, Misclassifications: 3
Epoch 8/20, Misclassifications: 4
Epoch 9/20, Misclassifications: 3
Epoch 10/20, Misclassifications: 3
Epoch 11/20, Misclassifications: 3
Epoch 12/20, Misclassifications: 4
Epoch 13/20, Misclassifications: 3
Epoch 14/20, Misclassifications: 3
Epoch 15/20, Misclassifications: 3
Epoch 16/20, Misclassifications: 3
Epoch 17/20, Misclassifications: 2
Epoch 18/20, Misclassifications: 3
Epoch 19/20, Misclassifications: 3
Epoch 20/20, Misclassifications: 5

Training Delta Rule:
Epoch 1/20, Total MSE: 5.8012
Epoch 2/20, Total MSE: 7.2435
Epoch 3/20, Total MSE: 7.2306
Epoch 4/20, Total MSE: 7.2229
Epoch 5/20, Total MSE: 7.2184
Epoch 6/20, Total MSE: 7.2160
Epoch 7/20, Total MSE: 7.2148
Epoch 8/20, Total MSE: 7.2145
Epoch 9/20, Total MSE: 7.2147
Epoch 10/20, Total MSE: 7.2152
Epoch 11/20, Total MSE: 7.2159
Epoch 12/20, Total MSE: 7.2166
Epoch 13/20, Total MSE: 7.2173
Epoch 14/20, Total MSE: 7.2179
Epoch 15/20, Total MSE: 7.2186
Epoch 16/20, Total MSE: 7.2191
Epoch 17/20, Total MSE: 7.2196
Epoch 18/20, Total MSE: 7.2201
Epoch 19/20, Total MSE: 7.2205
Epoch 20/20, Total MSE: 7.2208
Explanation:
Training the Perceptron:
We train the Perceptron for a maximum of 10 epochs.
After each epoch, we record the number of misclassifications.
If no misclassifications occur, training stops early.
Training the Delta Rule:
We train the Delta Rule for 100 epochs.
After each epoch, we record the total mean squared error.
The learning rate is set lower (
0.01) to ensure stable convergence.
Visualization:
Learning Progress:
For the Perceptron, we plot the number of misclassifications per epoch.
For the Delta Rule, we plot the total MSE per epoch.
Decision Boundary:
We visualize the decision boundary learned by each model.
For the Delta Rule, we apply a sigmoid activation to interpret outputs as probabilities and classify accordingly.
Output:
Learning Progress Plots:
Perceptron: Shows how misclassifications decrease over epochs.
Delta Rule: Shows how MSE decreases over epochs.
Decision Boundary Plots:
Perceptron: A straight line separating the two classes.
Delta Rule: Depending on activation, a boundary that best minimizes the error.
Perceptron Learning Rule is a straightforward algorithm suitable for linearly separable data. It adjusts weights only when misclassifications occur, leading to a binary decision boundary.
Delta Rule offers a more nuanced approach by minimizing the mean squared error, allowing for smoother weight adjustments even when data isn’t perfectly separable. It requires a differentiable activation function and is foundational for more complex neural network training.
Implementing both rules provides valuable insights into how early neural networks learned and highlights the evolution towards more sophisticated learning algorithms used today.